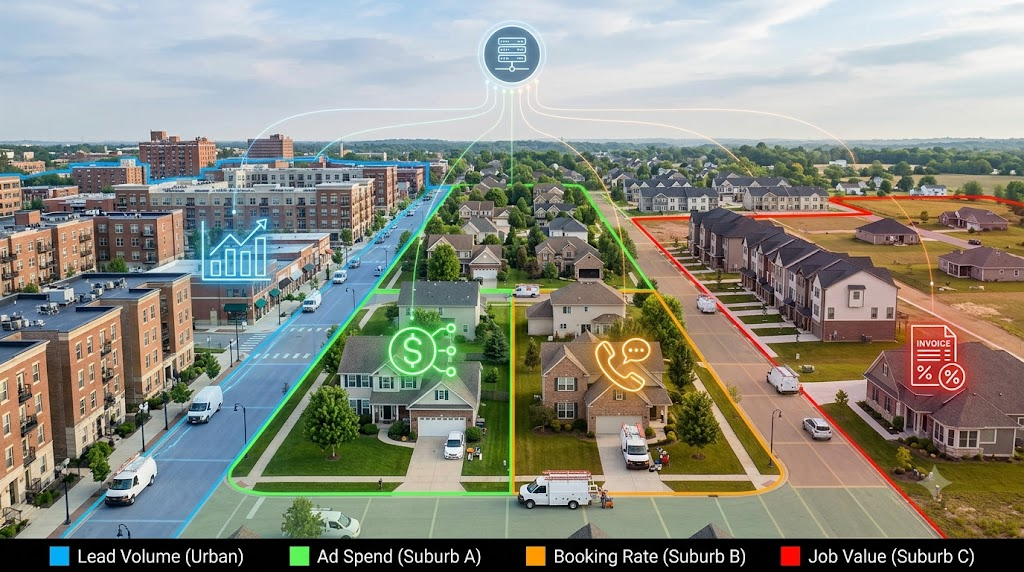
A home service company can generate strong total revenue while still making poor decisions about where to invest. Company-wide results may look healthy, but they do not reveal whether one ZIP code is producing profitable replacement jobs while another is consuming advertising budget without generating completed work.
That is why a revenue tracker should provide more than a running sales total. For an HVAC, plumbing, roofing or electrical business, useful revenue tracking connects each job to its service location, marketing source, booking history and final collected value.
What Revenue Tracking by Service Area Actually Means
Revenue tracking by service area organizes job and payment data by where work is delivered, such as by ZIP code, city, or territory. Unlike company-wide numbers, which mask local differences, location-level reporting reveals where growth actually originates. This prevents you from mistaking high-volume, low-value lead areas for those driving actual, high-ticket profitability.
Location-level reporting helps a company evaluate:
- Total and collected revenue by service area
- Booked, completed and cancelled jobs
- Revenue per job and average ticket value
- Marketing spend and customer acquisition cost
- Conversion and booking rates
- Service mix, demand and technician availability
For businesses already using home services marketing software, this geographic view can connect marketing performance with the operational outcome that matters most: profitable work.
Stop wasting budget on low-value zones. Track location-level profitability with precision.
Unlock Service Area Insights Now!
What Data Do You Need to Track Revenue by Service Area?
Accurate service-area reporting requires connecting customer, marketing, call, and job data. Relying on fragmented systems means advertising platforms, CRMs, and field-service software only see isolated pieces of the puzzle. Bringing this information together allows you to trace every dollar of revenue back to its true location and acquisition source.
Connect Marketing Sources With Customer and Job Locations
To track location accurately, connect the job address, where demand actually occurred, with the influencing marketing channel. Reliable attribution software binds these touchpoints directly to the customer record rather than stopping at the initial call. This links campaigns to actual revenue inside specific ZIP codes or territories.
The essential data typically includes:
- The customer or lead identifier
- The service address or assigned territory
- The original and influencing marketing sources
- The requested service
- The booking and completion status
- The invoice value and collected revenue
This creates the foundation for geographic revenue attribution.
Track Booked Jobs, Completed Jobs and Collected Revenue Separately
Bookings, completed jobs, and collected revenue are distinct stages. Treating them as interchangeable skews reports. For example, one area might have high bookings but heavy cancellations, while another yields fewer appointments but higher-value, completed projects. Tracking these stages separately reveals the true value of each location.
Home service companies should therefore distinguish between:
- Leads created
- Calls or forms qualified
- Appointments booked
- Jobs completed
- Revenue invoiced
- Revenue collected
This distinction is especially important when comparing marketing channels. A campaign that produces inexpensive leads may still have a weak return on ad spend if those leads fail to book or complete.
Connect the dots from first click to final payment. Maximize your true ad spend.
How Should Home Service Companies Compare Service-Area Performance?
Once the data is connected, each service area must be evaluated on a consistent basis. Simply ranking ZIP codes by total revenue can produce the wrong conclusion because areas may differ in size, service demand, marketing investment and technician coverage.
A strong comparison combines revenue with the cost and operational effort required to produce it.
Use Consistent ZIP Codes, Territories and Reporting Periods
Geographic boundaries should remain stable across reports. If one month is analyzed by city and another by loosely defined sales territories, the company cannot make a meaningful period-over-period comparison.
Before measuring location performance, establish:
- A standard ZIP-code or territory map
- A consistent definition of attributed revenue
- The same reporting period for every area
- Agreed rules for cancelled, refunded and unpaid jobs
- A consistent method for allocating shared marketing costs
Companies should also compare equivalent time periods. Seasonal demand can make a summer HVAC report look very different from a winter one, while storm activity may temporarily increase roofing demand in selected locations.
Year-over-year comparisons are often more useful than comparing consecutive months because they account more effectively for seasonality.
Compare Revenue With Marketing Spend, Conversion Rates and Ticket Value
Total revenue is only one part of service-area performance. A location producing $200,000 in revenue from $60,000 in marketing spend may be less efficient than an area producing $150,000 from $20,000.
Useful geographic metrics include:
| Metric | What It Reveals |
| Revenue per job | The typical value of completed work in the area |
| Average ticket value | Whether the market generates higher-value services |
| Conversion rate | How effectively leads become customers |
| Customer acquisition cost | How much it costs to gain a paying customer |
| Return on ad spend | How much attributed revenue advertising produces |
| Profit margin | Whether revenue remains valuable after service delivery costs |
These metrics help distinguish busy markets from profitable ones. They also reveal whether weak performance is caused by poor lead quality, low booking rates, small job values or excessive advertising costs.
Account for Seasonality, Service Mix and Technician Capacity
Marketing isn’t the only driver of revenue. Local demand shifts with seasons, service mixes, and technician availability. For instance, comparing high-ticket HVAC installs to quick plumbing repairs can lead to poor budget choices. Using trade-specific software helps operators measure realistic, localized performance.
A business should investigate whether an area has:
- Enough technician capacity to respond to demand
- A profitable mix of repair, maintenance and replacement work
- Strong booking and close rates
- Seasonal peaks or weather-related fluctuations
- Travel costs that reduce contribution margin
This context prevents the marketing team from cutting investment in a market where the real constraint is operational capacity.
Analyze your service areas with total clarity. Compare cost, capacity, and final conversions
How Does Service-Area Revenue Affect Marketing Investment?
The purpose of geographic revenue analysis is not merely to create another report. It is to improve budget allocation.
Once a home service company knows which areas produce valuable completed jobs, it can redirect advertising toward markets with the strongest combination of demand, conversion, ticket value and profitability.
Increase Marketing Spend in Areas Producing High-Value Jobs
A profitable service area may justify a greater share of paid search, direct mail, local campaigns or brand-building activity. However, the decision should be based on repeatable performance rather than one unusually large project.
Before increasing investment, confirm that the area consistently delivers:
- Strong completed-job revenue
- Healthy average ticket values
- Acceptable acquisition costs
- Enough operational capacity
- Profitable services the company wants to grow
Companies can also use the findings to tailor campaigns by area. A market generating replacement work may need different messaging from one dominated by maintenance or emergency calls.
Investigate Locations Generating Leads but Little Revenue
A high lead count can hide poor commercial performance. If one ZIP code generates many inquiries but little collected revenue, the company needs to find where the customer journey is breaking down.
Potential causes include:
- Low-quality or poorly targeted advertising
- Missed calls and slow follow-up
- Weak booking or close rates
- Long travel distances
- Limited technician coverage
- A low-value service mix
- Frequent cancellations or unpaid invoices
The correct response depends on the cause. Marketing spend may need to be reduced, but the solution could instead involve improved call handling, better scheduling or a different service offer.
This is why lead volume should never be assessed separately from booked jobs, completed work and revenue outcomes.
Stop throwing ad dollars down the drain. Fund the ZIP codes driving real growth.
How Mackdata Reveals the Locations Driving Revenue
Mackdata connects your existing CRM, call-tracking, and operational software instead of replacing them. By bringing this data together, it enables seamless, closed-loop attribution. This transforms manual service-area reporting into an active, data-driven decision-making process that helps you answer critical revenue questions.
The Benefits of Using Mackdata’s Attribution Software
Connect CRM, Call-Tracking, Advertising and Job Data
Home service companies often struggle with fragmented data across CRMs, call recordings, ad dashboards, and field software. Mackdata integrates these disconnected sources into a single, unified view. This creates a consistent map of the customer journey from the initial click to the final payment, eliminating the confusion of comparing mismatched reports with different definitions.
Attribute Marketing Touchpoints to Completed-Job Revenue
Closed-loop attribution tracks customers beyond the first click, connecting early touchpoints to bookings and completed job revenue. Instead of giving all credit to the final click, Mackdata recognizes every influential interaction. This allows home service businesses to evaluate channel performance based on actual revenue generated across different territories, rather than applying a one-size-fits-all model.
Ask Which ZIP Codes and Service Areas Are Most Profitable
Mackdata’s conversational AI assistant, Mack, allows teams to ask questions about connected business data in natural language. Instead of building a new static dashboard, an operator can investigate which service areas generate the highest revenue, where acquisition costs are rising or which territories have the strongest average ticket value.
Teams can then explore the reason behind the result. For example:
- Which ZIP codes produced the most completed-job revenue last quarter?
- Which markets have high lead volume but low booking rates?
- Where did Google Ads generate the strongest return on ad spend?
- Which service areas produce the highest-value replacement jobs?
- Which locations are growing year over year?
This approach makes complex reporting more accessible to decision-makers. Mackdata also provides guidance on how to visualize complex business data without overwhelming users with disconnected charts.